• Pantar Road, Lija, LJA2021
  • info@stl.com.mt
  • (+356) 22 584 300
  • BOOK A CALL
Logo
  • Home
  • About Us
  • Services
    • Professional Services
      • Network Services
      • Infrastructure Services
      • Cyber Security
      • Digital Solutions
    • Software Services
      • Custom Software Development
      • Outsourced Devops
    • ERP Solutions
      • Oracle Netsuite Services
    • Managed Services
      • Managed DBA
      • Managed BI Solutions
      • M365
      • Managed Network And Guest WIFI
      • Virtual Desktop
      • Managed Desktop
      • Managed Backup Solutions
    • Hospitality
      • Oracle MICROS Simphony POS
      • Oracle OPERA Cloud PMS
      • Oracle Hospitality Materials Control
      • Otrum Property TV Solution And Digital signage
      • IP Telephony
      • Smart BI
      • Smartorder
    • Cloud Services
      • Virtual Private Server (VPS) Hosting
      • Dedicated Servers
      • Cloud Backup Solutions
  • Partners
  • Blog
  • Careers
  • Contact Us
  • Helpdesk
    • Managed Services Help Desk
    • Hospitality Solutions Help Desk
    • Software Services Help Desk
    • Download Remote Support Tool

How much are you paying for O365?

  • Home
  • Blog Details
  • April 8 2020
  • stl_admin

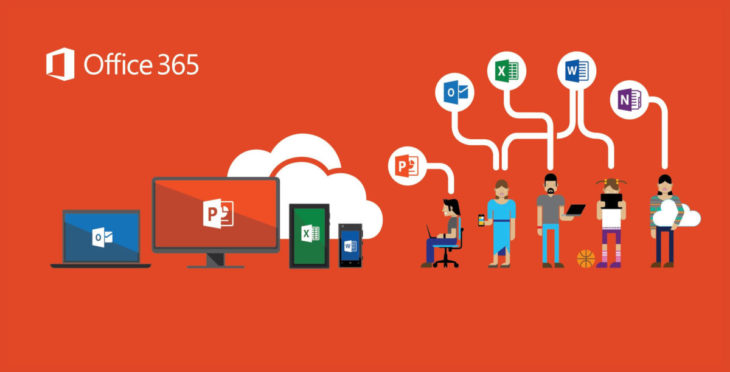
With the number of options available to purchase O365, its not the first time that you end up paying more for what you really need and are using.

One interesting tool within O365 is the Microsoft 365 Usage Analytics within Power BI.

Use Microsoft 365 usage analytics within Power BI to gain insights on how your organization is adopting the various services within Microsoft 365 to communicate and collaborate. You can visualize and analyze Microsoft 365 usage data, create custom reports and share the insights within your organization and gain insights into how specific regions or departments are utilizing Microsoft 365.

Microsoft 365 usage analytics is a template app that gives you access to a pre-built dashboard that provides a cross-product view of the last 12 months and contains a number of pre-built reports. Each report provides you with specific usage insights. User specific information is available for the last full calendar month.

The data model that powers the template app includes user attributes from Active Directory, enabling the ability to pivot in certain reports.

The following Active Directory attributes are included: Location | Department | Organization.

See Enable Microsoft 365 usage analytics to start collecting data.

Microsoft 365 usage analytics contains a number of reports detailed in the following sections:

  • You can access detailed reports for each area by selecting the data tables.
  • You can view all pre-built reports by selecting the tabs at the bottom of the site, once you are viewing the reports.

For more detailed instructions, read the Navigating & Utilizing Reports in Microsoft 365.

Contact us today to help you understand whether you are getting the utmost of your O365 subscription.

REACH US HERE

Previous Post
What is an Oracle Autonomous Database?
Next Post
Enhancing the patient experience through an innovative TV portal application

Leave a Comment Cancel reply

Recent Posts

  • The Rise of AI in Business Intelligence: Transforming Modern BI Strategies
  • Strengthening Operational and Cyber Resilience: Regulatory Drivers Shaping Financial Services in Malta
  • Top Cyber Threats in 2025: How to Protect Your Organisation
  • Smart Technologies Recognised as an Employee Approved Workplace
  • HPE VM Essentials: A true Hypervisor Alternative

Archives

  • April 2025
  • March 2025
  • February 2025
  • January 2025
  • December 2024
  • November 2024
  • September 2024
  • August 2024
  • July 2024
  • June 2024
  • May 2024
  • April 2024
  • March 2024
  • January 2024
  • October 2023
  • September 2023
  • August 2023
  • May 2023
  • February 2023
  • January 2023
  • December 2022
  • November 2022
  • July 2022
  • March 2022
  • January 2022
  • December 2021
  • November 2021
  • October 2021
  • April 2020
  • February 2020
  • April 2019
  • February 2019
  • January 2019
  • November 2018
  • September 2018
  • July 2018
  • May 2018
  • March 2018
  • February 2018
  • December 2017
  • September 2017
Shape
Logo

Smart Technologies has been in business since 2008, establishing partnerships and serving loyal clients, from huge companies to startups.

Useful Links

  • Home
  • About Us

Our Services

  • Professional
  • Software
  • ERP
  • Managed
  • Hospitality
  • Cloud

Contact Info

  • Smart Technologies Ltd. Navi Buildings Level 1, Pantar Road, Lija, LJA2021
  • info@stl.com.mt
  • (+356) 22 584 300

    ISO 9001

© Copyright 2023. All Rights Reserved Smart Technologies Ltd.

another website by TheWebAlly Logo

  • Home
  • About